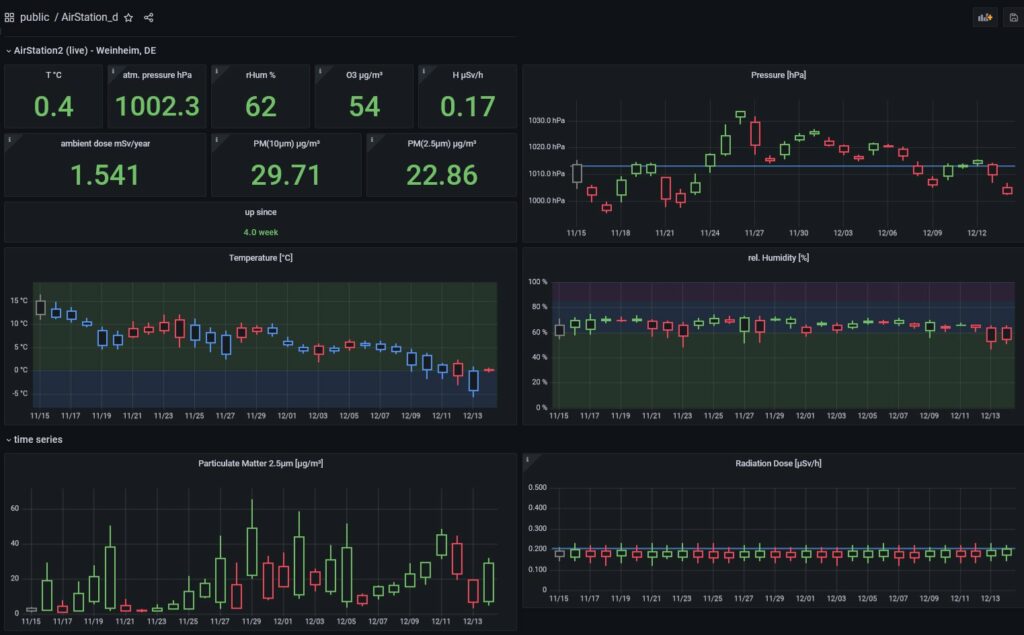
AirStation 2.0 passed 180h testing.
now: 6/6 sensors online for “Weinheim, DE” in a Grafana-Dashboard
Following an initial version, I wanted to learn and extend from this experience:
- Ozone sensor employed so far was a Winsen MQ131 analog sensor, sampled via a voltage divider/ADC circuit. The sensor required extensive burn-in and base resistance calibration and appeared to be critically sensitive to moisture – far beyond what was charted in the MQ131 datasheet’s figure 4: Rs/Rs0 vs. Temperature plot for 3 distinct values of rH%. While I was able to derive a continuous correction function(rH%,T) by interpolating between the graphs provided by the datasheet, this eventually did not resolve the humidity issue. From analysis of environmental data collected so far, MQ131 “runaways” in O3 reading coincided nicely with early morning humidity values rH > 65%. Looks like we have to abandon this cheap thing and go for Winsen’s digital sensor: ZE25-O3. Fortunately, AliExpress was quick to deliver !
- AirStation’s central library “myTaskSchedulder” is controlling the asynchronous scheduling of various data sampling tasks and pre/post processing requirements and has seen multiple updates and fixes inspired by the ongoing StratoExplorer project which equally benefits from the lib’s capabilities.
- While O3 and particulate matter are already quite rare for privately operated sensors, I wanted to add this one more thing that would make it unique of it’s kind: γ/β radiation ambient dose rate, i.e. a Geiger-Mueller tube counter.
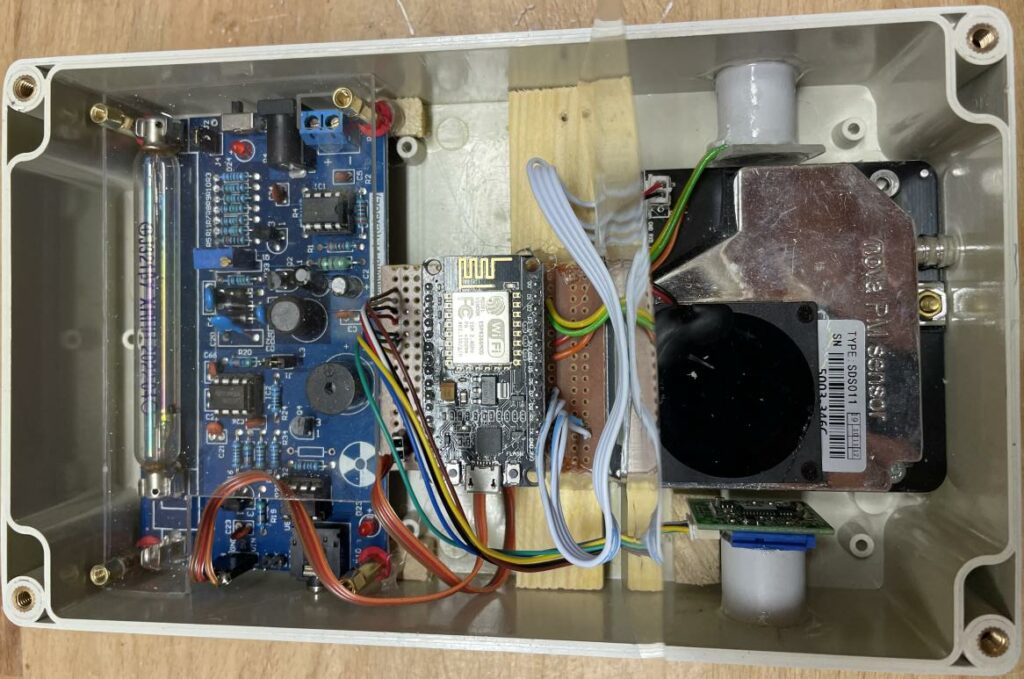
AirStation 2.0 specs after success lab testing:
- CPU: ESP8266-NodeMCU v2.8 µ-controller with WiFi.
- OTA software updates with AS2.0 remaining connected to domestic WiFi.
- DNS device name broadcast
- NTP time reference for myTaskScheduler
- Web service endpoint, delivering AS2.0 JSON data.
- AirStationDb python backend + Postgres database (both on Pi3B) polling/storing AS2.0 data
- 4 Sensor Tasks registered with myTaskScheduler:
- Each of the sensor value(s) stored with sample time, average, min/max, standard-deviation.
- Grafana dashboard (backend) showing spot values and time course.
Implementation notes:
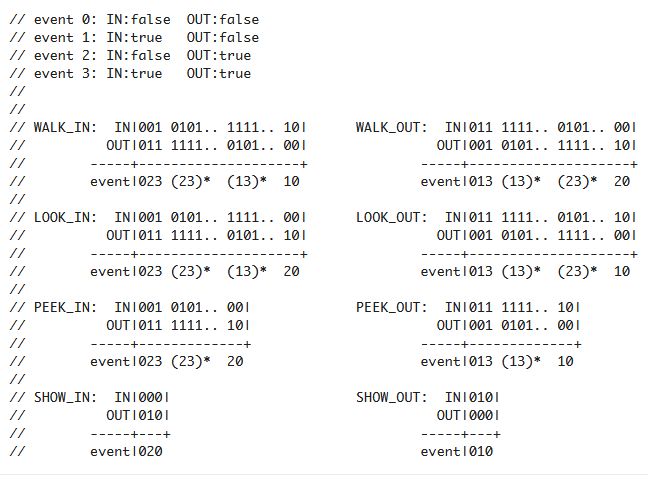
ESP8266 is ideally suited for WiFi based IoT applications thanks to multiple, configurable digital ports. However, simultaneously connecting that many digital applications to a single device is creating issues due to subtle limitations on the CPU’s pins, i.e. interrupt capability, logic levels, behavior during device boot and flashing.
Ozone: ZE25-O3 connected via (Software-)Serial (9600, 8N1). Sensor has two modes that can be selected via serial: i. periodic reports, ii. on-demand reports. The latter mode appears handy but has a documented issue with ESP8266 software-serial. That’s why we operate in (default) periodic mode and invest a bit in parsing queued messages from the serial buffer. Since we are anyhow running out of hardware-serials on ESP8266 (and wanted to keep Serial-0 for bench-diagnostics), sw-serial is a good choice, because it’s ESP8266 implementation is able to handle multiple connections (at low baud rate). With choosing periodic-mode, we can use RX on pin D6 and abandon host TX, thus releasing one interrupt-capable digital pin D5 for the radiation sensor count trigger. Digital O3 readout is in ppb units, conversion to µg/m³ applied taking into account temperature correction according to EU standards. Sampling every 10 minutes for 1 minute at 2s intervals.
Particulate Matter (PM): SDS011 connected via (Software-)Serial (9600, 8N1). Needs both RX/TX to read data from device and switch on/off fan and laser. Warm up time 30s, 2 minutes sampling at 2s intervals, triggered every 3 hours: commanded by myScheduler. Caution: From available pins D7/D8 use D7 for RX. D8 is pulled to GND, boot fails if HIGH. Humidity correction applied according to Zbyszek Kiliański.
Radiation: Interrupt controlled, Geiger-Mueller tube J321 identified as J305/M4011 compatible. Count-per-minute / dose [µS/h] conversion factor: 0.00655. Connected to ESP D5 with an ISR which handles event counting independently from any other tasks. Rate computation + statistics controlled via myTaskScheduler: every 10 minutes for 5 minutes of event data.
BME280 THP: Connected via standard I2C bus SCL/SCA (D1/D2). Continuous sampling every 2s on a 5 minutes sliding average.
Code sample showing basic AS2.0 design:
main.cpp:

[..]

#include <myWifi.h>
#include <AirStation.h>
#include <AirStation_cfg.h>

#include <SensorPM.h>
#include <SensorO3.h>
#include <SensorTHP.h>
#include <SensorRAD.h>

[..]

// myTaskScheduler is given a reference time: SysTime
// SysTime is initialized with reference to wifi's getTimestamp()
// (This works equally well myGPS lib, providing sat-based time)
//
auto wifi = myWifi(CBN_HOME);
auto st   = new SysTime(std::bind(&myWifi::getTimestamp, wifi));
auto ts   = new myTaskScheduler(st);

[..]

//
// SYSTEM SETUP
//

void setup() {

  Serial.begin(28800);
  Serial.println("AirStation - setup:");

  // Tasks being registered with myTaskScheduler
  // Custom task must inherit from a generic Task class
  //
  ts->addTask("THP", new SensorTHP)->setOnError(RECOVER);
  ts->addTask("PM" , new SensorPM )->setOnError(RECOVER);
  ts->addTask("O3" , new SensorO3 )->setOnError(RECOVER);
  ts->addTask("RAD", new SensorRAD)->setOnError(RECOVER);

  ts->setPrintLevel(DEBUG_LEVEL);

  wifi.start();

  // some configuration options for SysTime
  st->setTimeformat(&formatAirStationTimestamp);
  st->setSyncInterval(12*3600);
  st->autoTimeformat(true);
  st->setSyncMode(AUTO);

  [..]

  bool status = ts->resetTasks() && ts->testTasks();
  Serial.printf("SETUP: %s\n", status ? "OK":"FAILED");

}

//
// MAIN LOOP
//
void loop() {

  server.handleClient();  // handle webservice requests

  ts->run();              // have myTaskSchedule do its scheduling business
  st->checksync();        // check sync with time reference

}
Next steps:
Finally assembly caused unexpected harm to the O3 digital sensor: When the sensor was mounted into a short plastic tube connecting it with the atmosphere outside the box, solvent-containing plastic glue was used. While drying, intense hydrocarbon vapor however “blinded” the sensor beyond recovery – a fact that was clearly pointed out in the sensor’s data sheet: “Do not leave the module in a high concentration of organic gas for long time which will cause the sensor zero point to drift and recover slowly” – I told myself: r.t.f.m, next time I will study every tiny detail of hardware documentation ! A replacement sensor is on it’s way from China.
Edit 25.08.2022: The new sensor has arrived from China and was tested ok. But, getting stable O3 readings is a challenge ! Two reasons for this: 1) 4-sensors setup: It appears that AirStation – once booted – performs flawlessly to process data from all sensors. However, with co-existence of radiation and ozone sensors (and the increase in wiring and EMI), there is an issue with ESP8266 boot mode due to “floating” pins which require the RST button to be pressed to properly initiate boot. 2) The Winsen ZE25-O3 is not only very sensitive to gas concentration but also to any airflow impacting the cover membrane of the device. Isolating the chip in a tube connected to a hole in the AirStation box turned out to be a bad idea in “outdoor” conditions. Any air movement flowing alongside or into the opening is inducing pressure oscillations which are being magnified by the sensor. Therefore it is more appropriate to locate the sensor protected within the box and rely on “smooth” air exchange induced by regular runs of the PM sensor fan.
Edit 14.09.2022: Winsen ZE25-O3 sensor has been relocated inside the box and EMI issues have been fixed. AirStation now running on ALL sensors: temperature, humidity, pressure, particulate matter, ozone, ambient radiation. This has required a downtime on Sep 14 resulting in a gap in the data recordings.